

Generate stunning visuals with AI Infographics chrome extension
Our AI infographic generator's Google Chrome extension lets you create infographics without leaving the browser.

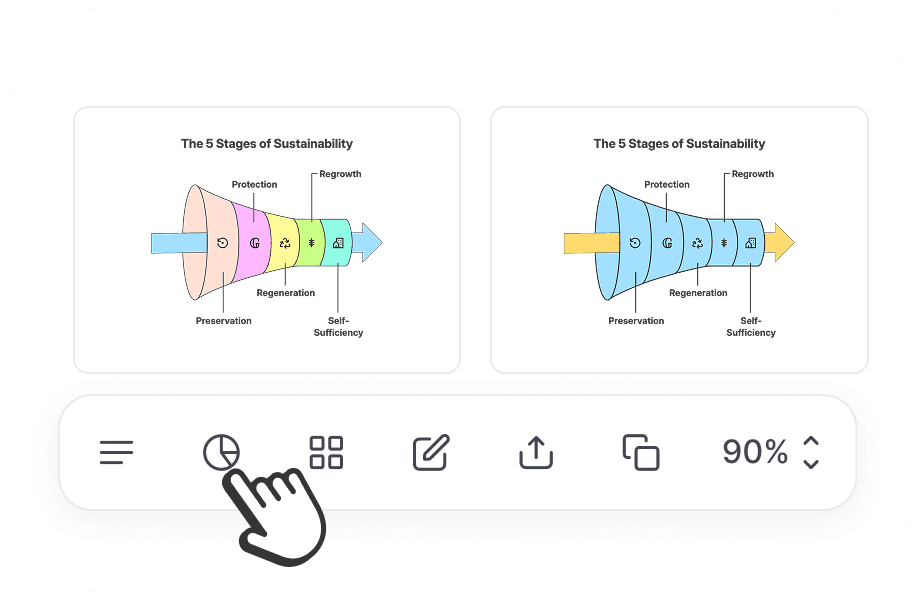
Quick Action Buttons
Quick Action Buttons


Clean and Minimal Layout
Clean and Minimal Layout
Why choose us
Why choose us
Get engaging AI-Generated Infographics instantly
Choose from 100+ templates including timelines, funnels, workflows, and more. Customize each layout directly to match your content in seconds.

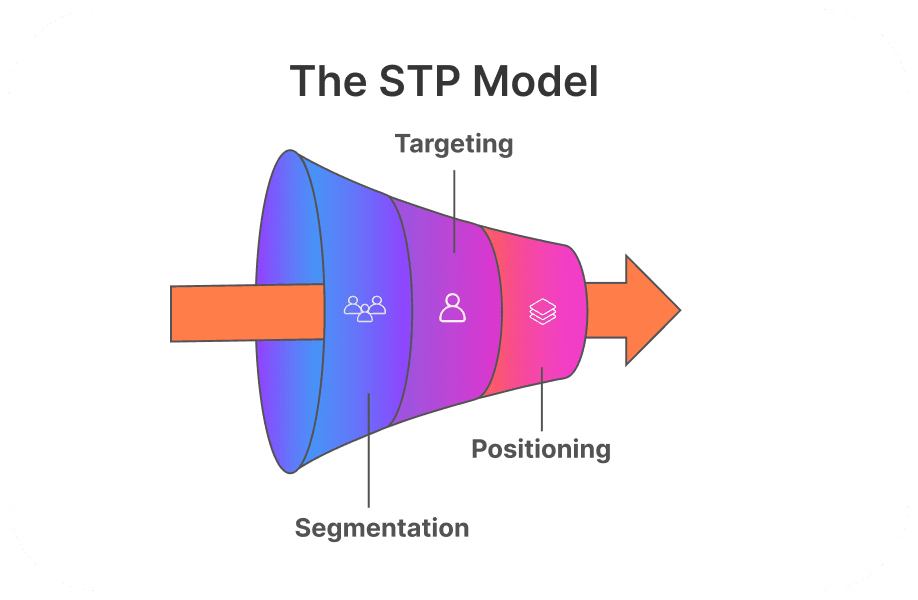
🛠 Funnel diagrams
Visualize customer journeys, sales conversions, and marketing funnels with ease


🔄 Cyclic process
Show a series of steps or events that repeat without a clear end with stunning infographics


🚀 Step-by-step journeys
Visually simplify and break down a complex process and data points into easy-to-digest steps infographic


🏛 Hierarchy charts
Visualize text that goes from smallest to biggest or most important to least important and vice versa


📍 Roadmaps
Track projects, take account of milestones and pave the way for better communication and collaboration


⏳ Timelines
Condense lifetime journey information into a simplified and visually appealing format, making it easier for audiences to grasp


🧠 Mind maps
Use mind mapping infographics for project planning, strategic thinking, and managing meetings

📊 Numbered listicle
Visually show your actionable items and get a clear and concise infographic which is shareable across all formats


🔧 Pipeline
Visually demonstrate concepts like sales pipelines, project management, or supply chain pipelines


Features
Elevate any content with engaging visuals
Whether simplifying reports or improving digital content, AI-powered infographics can enhance clarity, boost retention, and instantly make content more compelling.
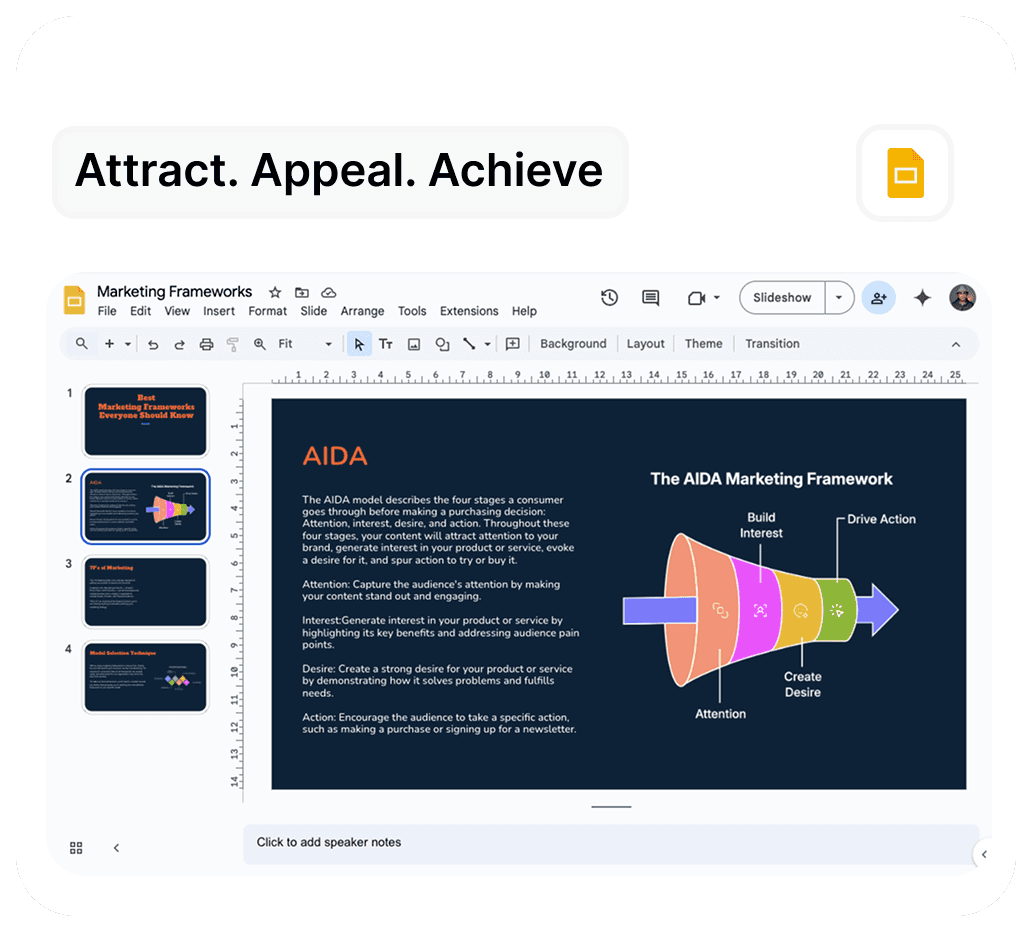
Make your presentations clear & impactful
Simplify wordy data with infographics
Generate professional visuals in seconds. Whether it’s a report, a pitch, or a meeting, AI-generated infographics make presentations clearer and more engaging—right from your browser.
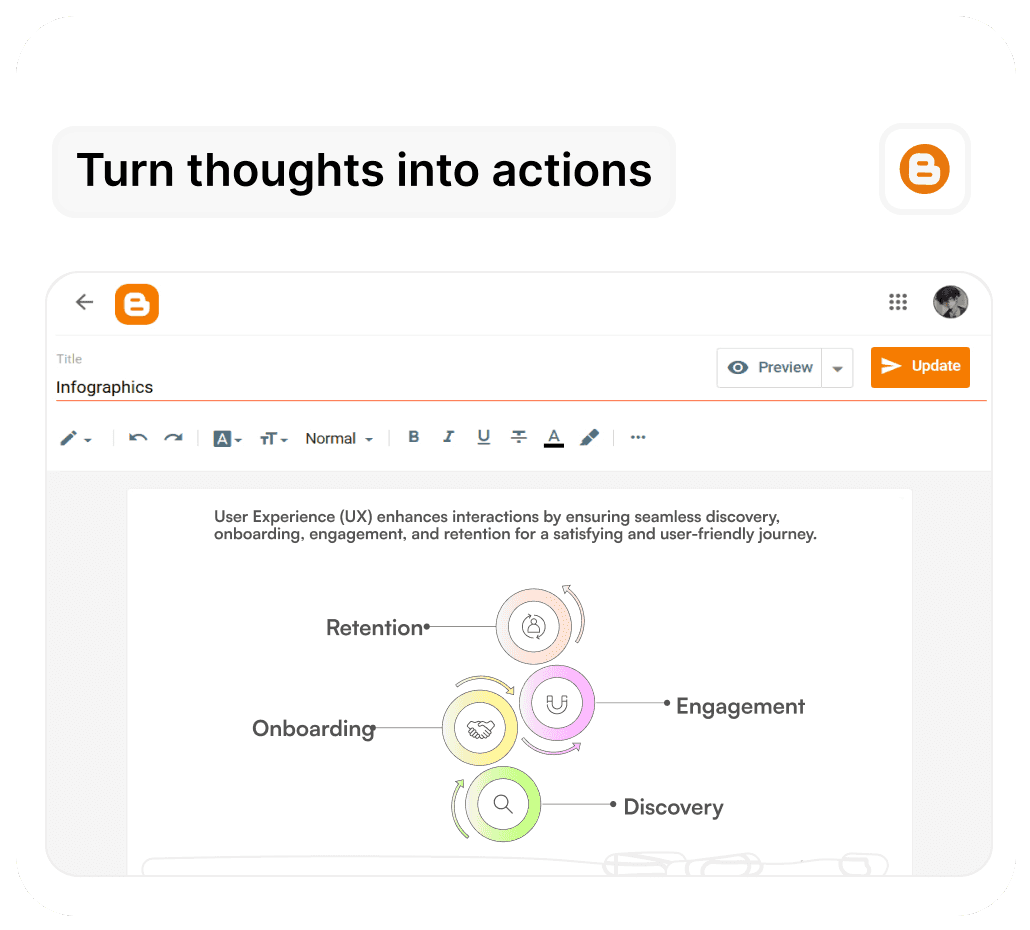
Add visuals to your blog Content Instantly
Make Every Blog Visually Engaging
Adding visuals to blog content makes information clearer, more engaging, and easier to retain. AI-generated infographics help break down complex ideas, highlight key insights, and improve readability.
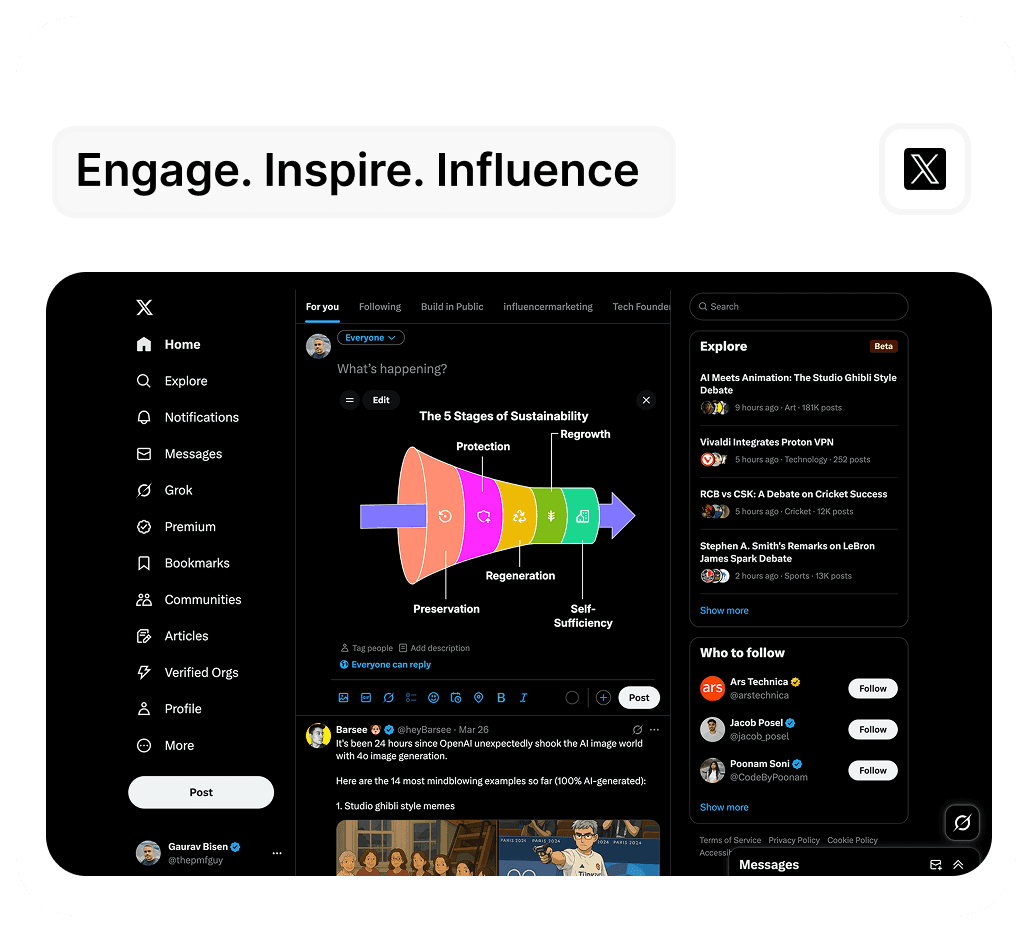
Drive Engagement on Social Media Platforms
Turn Insights Into Infographics in Seconds
Share updates, data, or ideas as visuals that stand out in every feed. With AI Infographics, generate clean, engaging graphics—ready to publish across platforms in a single click.
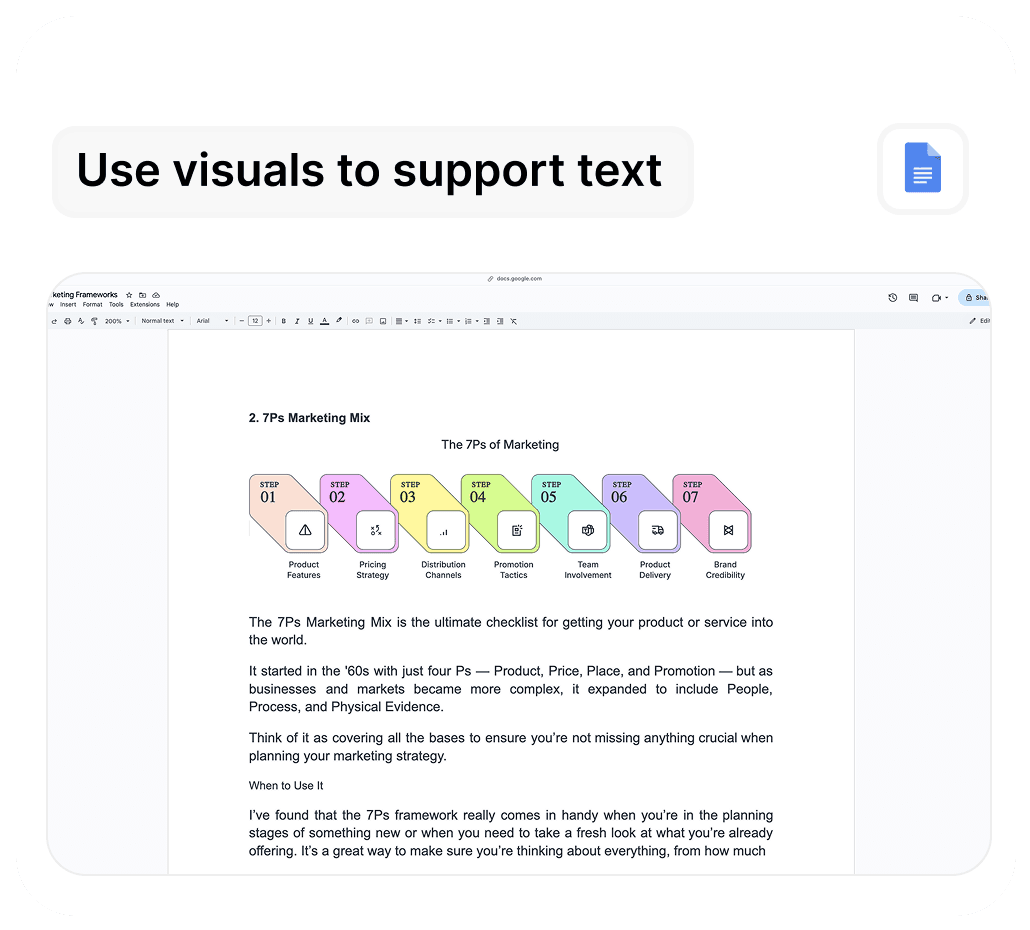
Improve Documentation with AI Infographics
Simplify Complex Information Into Visuals
Explain processes, data, and instructions more clearly with visual support. Infographics can highlight key points, clarify processes, and present information in a format that’s quick to grasp and simple to share.
Features
Elevate any content with engaging visuals
Whether simplifying reports or improving digital content, AI-powered infographics can enhance clarity, boost retention, and instantly make content more compelling.
Make your presentations clear & impactful
Simplify wordy data with infographics
Generate professional visuals in seconds. Whether it’s a report, a pitch, or a meeting, AI-generated infographics make presentations clearer and more engaging—right from your browser.
Add visuals to your blog Content Instantly
Make Every Blog Visually Engaging
Adding visuals to blog content makes information clearer, more engaging, and easier to retain. AI-generated infographics help break down complex ideas, highlight key insights, and improve readability.
Drive Engagement on Social Media Platforms
Turn Insights Into Infographics in Seconds
Share updates, data, or ideas as visuals that stand out in every feed. With AI Infographics, generate clean, engaging graphics—ready to publish across platforms in a single click.
Improve Documentation with AI Infographics
Simplify Complex Information Into Visuals
Explain processes, data, and instructions more clearly with visual support. Infographics can highlight key points, clarify processes, and present information in a format that’s quick to grasp and simple to share.
Features
Elevate any content with engaging visuals
Whether simplifying reports or improving digital content, AI-powered infographics can enhance clarity, boost retention, and instantly make content more compelling.
Make your presentations clear & impactful
Create Impactful Slides Effortlessly
Generate professional visuals in seconds. Whether it’s a report, a pitch, or a meeting, AI-generated infographics make presentations clearer and more engaging—right from your browser.
Add visuals to your blog Content Instantly
Make Every Blog Visually Engaging
Adding visuals to blog content makes information clearer, more engaging, and easier to retain. AI-generated infographics help break down complex ideas, highlight key insights, and improve readability.
Drive Engagement on Social Media Platforms
Turn Insights Into Infographics in Seconds
Share updates, data, or ideas as visuals that stand out in every feed. With AI Infographics, generate clean, engaging graphics—ready to publish across platforms in a single click.
Improve Documentation with AI Infographics
Simplify Complex Information Into Visuals
Explain processes, data, and instructions more clearly with visual support. Infographics can highlight key points, clarify processes, and present information in a format that’s quick to grasp and simple to share.
Infographic templates for every use case
AI Infographics offers different templates built for educators, marketers, teams, researchers, and content creators.

Education & learning
Visualize lessons, summaries, and concepts clearly. Use infographics to simplify complex topics and improve learning.
Education & learning
Visualize lessons, summaries, and concepts clearly. Use infographics to simplify complex topics and improve learning.
Business reports
Present metrics, performance data, and workflows with clarity. Infographics help teams and stakeholders absorb key information faster.
Business reports
Present metrics, performance data, and workflows with clarity. Infographics help teams and stakeholders absorb key information faster.
Research visualization
Break down data sets, findings, and trends into digestible visuals. Infographics help make research easier to understand and share.
Research visualization
Break down data sets, findings, and trends into digestible visuals. Infographics help make research easier to understand and share.
Content creation
Add visual elements to blogs, articles, and social posts in seconds. Infographics help boost readability and engagement.
Content creation
Add visual elements to blogs, articles, and social posts in seconds. Infographics help boost readability and engagement.
Marketing & promotion
Turn campaigns, funnels, and strategies into visual formats. Use infographics to share the information quickly.
Marketing & promotion
Turn campaigns, funnels, and strategies into visual formats. Use infographics to share the information quickly.
Strategy mapping
Outline plans, processes, or timelines visually. Use infographics to communicate direction, phases, and goals at a glance.
Strategy mapping
Outline plans, processes, or timelines visually. Use infographics to communicate direction, phases, and goals at a glance.
Features
Make any text visually engaging in seconds
No extra steps—just add your text, select a template, and get your infographic instantly.
Get infographics instantly
Simply add your text
Simply add your text
Add your content and choose from the variety of templates that suits your needs. Pick and generate in seconds.
Add your content and choose from the variety of templates that suits your needs. Pick and generate in seconds.

Fully editable templates
Fully editable templates
Customize any infographics
Customize any infographics
Edit the generated infographics to match the colors, fonts, and visual style of your brand.
Edit the generated infographics to match the colors, fonts, and visual style of your brand.

Instant export support
Instant export support
Easily export & share
Easily export & share
Download the AI-generated infographics in PNG or SVG and use them anywhere you want.
Download the AI-generated infographics in PNG or SVG and use them anywhere you want.
Instant
Downloads

Our success stories in numbers
AI Infographics is already helping individuals and has a proven impact across industries:
+
Infographics created
Join a growing community of professionals who regular use our platform for generating the infographics.
%
User satisfaction rate
With a 98% user satisfaction rate, we get a 4.8/5 average rating from the users for our roadmap templates.
+
Templates support
Our text to Infographics AI has variety of templates that you can customize as per your needs.
Pricing
Flexible pricing plan
Whether you're just starting or need unlimited customization, our plans are designed to fit your designs & brand language
Monthly
Annually
Free forever
$ 0
per month
Get started for free and enjoy all product features.
Up to 3 generations
All product features
Customised branding
No watermarks
24/7 email support
Paid plan
Popular
$ 5
per month
Start your professional journey and explore unlimited generations.
Unlimited generations
All product features
Custom branding & styles
No watermarks
24/7 email support
Monthly
Annually
Free forever
$ 0
per month
Get started for free and enjoy all product features.
Up to 25 generations
All product features
Customised branding
No watermarks
24/7 email support
Paid plan
Popular
$ 5
per month
Start your professional journey and explore unlimited generations.
Unlimited generations
All product features
Custom branding & styles
No watermarks
24/7 email support
FAQ
Frequently asked questions
For any unanswered questions, reach out to our support team via email. We'll respond as soon as possible to assist you.
Is the AI Infographics extension free to use?
We offer a free version with essential features and a premium plan that unlocks advanced customization, more template options, and unlimited infographics generations.
Is the extension compatible with Google Docs, Slides, or other web apps?
Can I customize the infographics generated by the extension?
How do I generate an infographic from text using the extension?
What types of infographics can I create with this Chrome Extension?
Get Started
Start creating stunning Infographics with AI
Create professional infographics in seconds with AI infographics, that make your content impossible to ignore.
Instant Generation


Get Started
Start creating stunning Infographics with AI
Create professional infographics in seconds with AI infographics, that make your content impossible to ignore.
Instant Generation
Get Started
Start creating stunning Infographics with AI
Create professional infographics in seconds with AI infographics, that make your content impossible to ignore.