Get customizable cycle diagrams instantly with AI Infographics

Create clean, editable, and export-ready cycle diagrams in seconds with our powerful infographic generator.

Hero Image
Hero Image
Hero Image

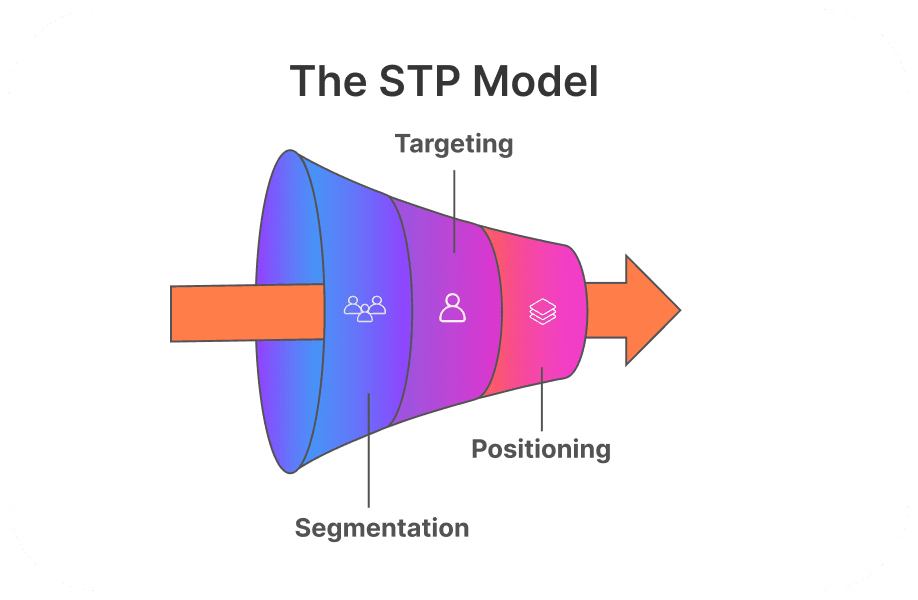
Ready-to-use cycle diagrams for every industry

Whether you're mapping out feedback loops or explaining operational cycles, our cycle infographics fit seamlessly into any workflow.

Business workflows

Visualize recurring business models, agile frameworks, and marketing funnels using intuitive cycle diagrams.

Business workflows

Visualize recurring business models, agile frameworks, and marketing funnels using intuitive cycle diagrams.

Business workflows

Visualize recurring business models, agile frameworks, and marketing funnels using intuitive cycle diagrams.

Icon

Educational visuals

Explain biology cycles, scientific models, and ecosystem flows using engaging visuals for learning and retention.

Icon

Educational visuals

Explain biology cycles, scientific models, and ecosystem flows using engaging visuals for learning and retention.

Icon

Educational visuals

Explain biology cycles, scientific models, and ecosystem flows using engaging visuals for learning and retention.

Icon

Executive summaries

Add high-impact diagrams to reports and strategy decks to clearly communicate cyclic business processes.

Icon

Executive summaries

Add high-impact diagrams to reports and strategy decks to clearly communicate cyclic business processes.

Icon

Executive summaries

Add high-impact diagrams to reports and strategy decks to clearly communicate cyclic business processes.

Icon

Product development cycles

Map iteration loops, release schedules, and design stages for better team alignment and planning.

Icon

Product development cycles

Map iteration loops, release schedules, and design stages for better team alignment and planning.

Icon

Product development cycles

Map iteration loops, release schedules, and design stages for better team alignment and planning.

Onboarding & internal training

Simplify team onboarding and SOPs using cycle diagrams that explain internal workflows and training loops.

Onboarding & internal training

Simplify team onboarding and SOPs using cycle diagrams that explain internal workflows and training loops.

Onboarding & internal training

Simplify team onboarding and SOPs using cycle diagrams that explain internal workflows and training loops.

Icon

Marketing campaigns

Showcase campaign flows, content cycles, and lead nurturing funnels using branded, reusable visuals.

Icon

Marketing campaigns

Showcase campaign flows, content cycles, and lead nurturing funnels using branded, reusable visuals.

Icon

Marketing campaigns

Showcase campaign flows, content cycles, and lead nurturing funnels using branded, reusable visuals.

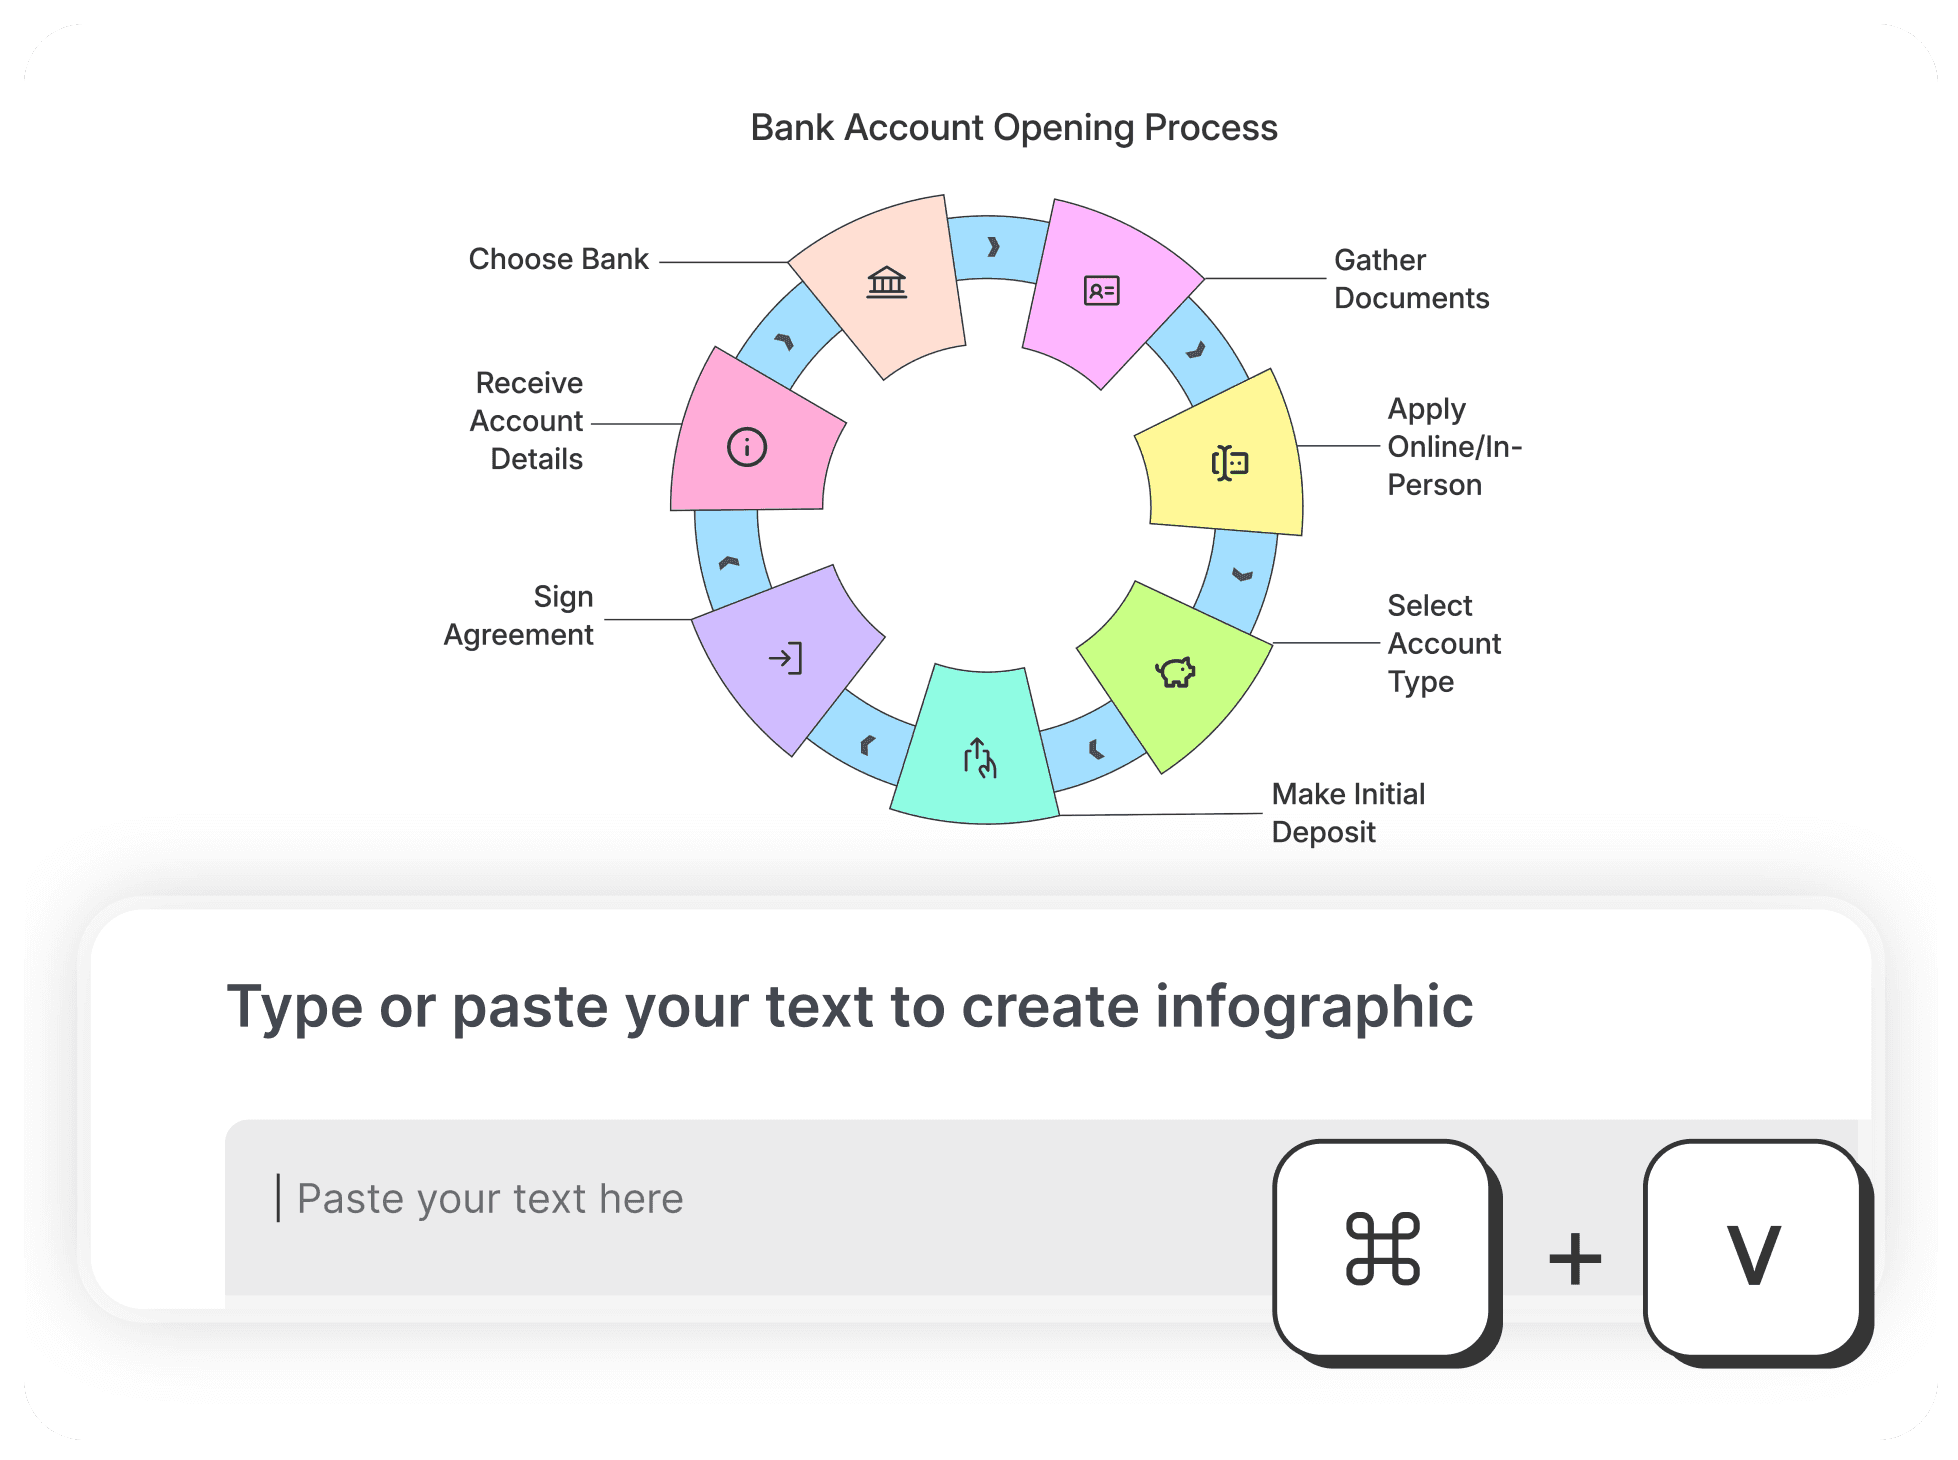
Generate cycle diagrams in three simple steps

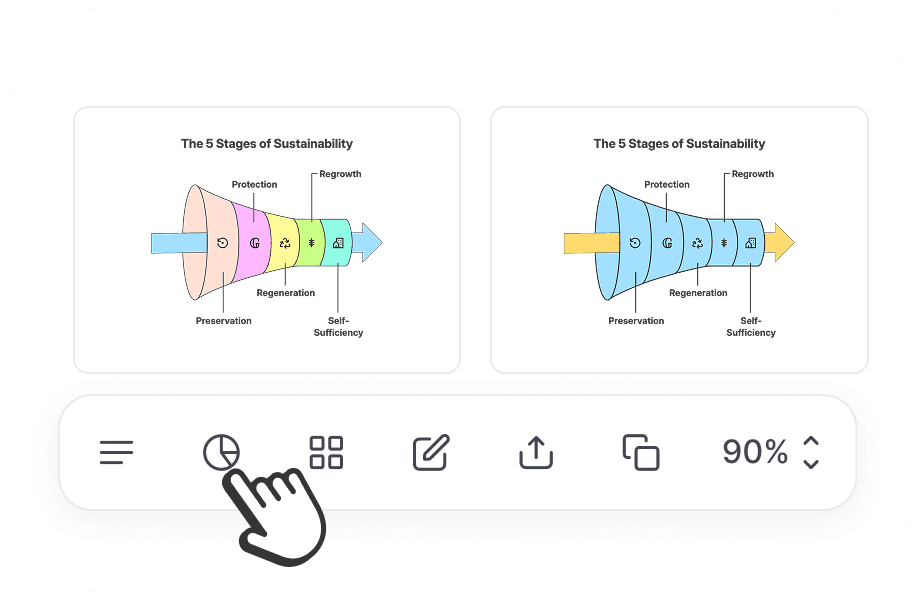
Generate cycle diagrams instantly and customize layout, design, and content as per your needs

Simple-to-generate

Just paste your text

Just paste your text

Add your content, and our AI infographic generator will format it into a clear, visual cyclic process layout.

Add your content, and our AI infographic generator will format it into a clear, visual cyclic process layout.

Feature Image
Feature Image

Easy-to-customize

Editable cycle diagrams

Editable cycle diagrams

Adjust colors, icons, and layout of the templates to align with your brand or project theme.

Adjust colors, icons, and layout of the templates to align with your brand or project theme.

Feature Image
Feature Image

Instant export options

Simple to export

Simple to export

Export your cycle diagram in high-quality PNG or SVG format—ready for presentations, documents, or the web.

Export your cycle diagram in high-quality PNG or SVG format—ready for presentations, documents, or the web.

Benefits Image

Instant Downloads

Feature Image
Feature Image

Overview

Smarter cycle diagrams, designed for clarity

Quickly generate cycle diagrams that explain any circular process—clean layouts, flexible templates, and instant exports.

Product overview

AI-Powered designs

Our text-to-infographics AI can automatically arrange elements for engaging visual clarity for your cycle diagrams.

Icon

Custom brand

Choose from a wide range of fonts, and colors to ensure cycle infographics match your brand.

Icon

Full customization

Adjust every element, preview your work, and download your infographics in various formats like PNG or SVG.

40

%

Usage

Visual content is processed 60,000 times quicker than text. 55% of professionals create infographics more than any other visual media

Background Image

Our success stories in mumbers

Infographics AI makes it easy to organize complex information into clear, structured cyclic visuals for teams, businesses, and educators.

100

+

Cycle diagrams created

Join a global community of professionals who rely on our templates to simplify complex information.

0

%

User satisfaction rate

With a 98% user satisfaction rate, we get a 4.8/5 average rating from the users for our infographic templates. 

0

+

Stunning templates

Our text to Infographics AI has variety of cycle diagrams that you can customize as per your needs.

Why Choose Us

Why Choose Us

Export and share anywhere

Download and use your Cycle Diagrams in PowerPoint, Google Slides, Notion, and many more.

Pricing

Pricing

Affordable plan for every user

Start with the free version and upgrade to access premium features.

Monthly

Yearly

Save 33%

For unlimited usage and customizations

$5

per month, billed yearly

Icon

Unlimited generations & customisation

Icon

All product features

Icon

Customised branding

Icon

No watermarks

Icon

24/7 support

Monthly

Yearly

Save 33%

For unlimited usage and customizations

$7.5

per month

Icon

Unlimited generations & customisation

Icon

All product features

Icon

Customised branding

Icon

No watermarks

Icon

24/7 support

Monthly

Yearly

Save 33%

For unlimited usage and customizations

$7.5

per month

Icon

Unlimited generations & customisation

Icon

All product features

Icon

Customised branding

Icon

No watermarks

Icon

24/7 support

Frequently asked questions

For any unanswered questions, reach out to our support team via email. We'll respond as soon as possible to assist you.

What is a step-by-step infographic?

A step-by-step infographic is a visual representation of a process or sequence of actions. It breaks down tasks into clear, ordered steps using graphics and text for better understanding and retention.

How do I create a step-by-step infographic from text?

Can I customize the layout and colors of step-by-step templates?

What are the best use cases for step-by-step infographics?

Can I change the number of steps in the infographic after generation?

Get Started

Start creating stunning Infographics with AI

Create professional infographics in seconds with AI infographics, that make your content impossible to ignore.

Instant Generation

Icon
Image
Image
Image
Background Image

Get Started

Start creating stunning Infographics with AI

Create professional infographics in seconds with AI infographics, that make your content impossible to ignore.

Image
Image
Image
Background Image

Get Started

Start creating stunning Infographics with AI

Create professional infographics in seconds with AI infographics, that make your content impossible to ignore.

Instant Generation

Icon
Image
Image
Image
Background Image